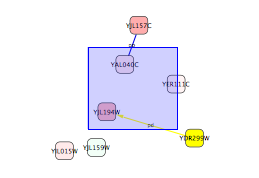
Getting Started Guide (New sections added for 2.6.0)
Contents
Introduction
Welcome to Cytoscape, a free open-source software application for visualizing and analyzing networks. This Getting Started Guide will show you the basic steps for creating a network from your data, while highlighting relevant sections of the Cytoscape User Manual that provide more in-depth information.
Cytoscape creates networks, where nodes of the network represent objects (such as proteins) and connecting edges represent relationships between them (such as physical interactions). Once this basic network is created, various attributes of the nodes and edges (such as protein expression levels or strength of interaction) can be added to the network and incorporated as visual cues like shape or colour. Networks can then be analyzed in many different ways using "plugins".
Before Getting Started
To use Cytoscape, you will need:
a relatively recent computer: Larger networks will require more computing power than smaller ones. To allocate more memory to Cytoscape, see “How_to_increase_memory_for_Cytoscape”.
See also "Launching Cytoscape"
Java SE 6: The Java Runtime Environment (JRE) must be installed on your computer. If necessary, you can download the newest version of Java for free at http://java.sun.com/javase/downloads/index.jsp.
Cytoscape This can be downloaded from http://cytoscape.org and installed on Windows, Mac OS X, and Linux computers.
See also "Install Cytoscape"
a file containing interaction data: Currently supported file extensions include .xls (ie. an Excel workbook organized in columns), .sif, .gml, .xgmml, and .cys (Cytoscape session files). Other supported file formats include delimited plaintext, SBML, PSI-MI, and BioPAX. A number of example files have been included in the Sample Data folder downloaded as part of Cytoscape. For a sample Excel file, right-click on and save galFiltered.xls, and for a sample text file, right-click on and save sample.txt. You can also manually draw a network.
- Standard supported file types:
- SIF (Simple Interaction Format): a text format invented for Cytoscape
- GML (Graph Markup Language): standard network file format; supported by multiple generic network software packages
- XGMML (eXtensible Graph Markup and Modelling Language): XML standard; similar to but preferred over GML
- SBML (Systems Biology Markup Language): XML standard for representing mathematical pathway models
- PSI-MI (Proteomics Standards Initiative - Molecular Interaction format): XML standard for molecular interactions; supported by molecular interaction databases
- BioPAX (Biological PAthway eXchange): standard format for pathway information; supported by multiple pathway databases.
See also "Supported Network File Formats", "Editing Networks"
- Standard supported file types:
Part 1: Loading Your Interaction Data
Step 1: Open Cytoscape by clicking the Cytoscape icon created during installation.
Note: Alternatively, Cytoscape can be opened in Windows by double-clicking cytoscape.bat or cytoscape.jar, or in Linux/Mac OS X by running cytoscape.sh. Cytoscape can also be started directly from the command line. See also "Launch the Application" and "Command Line Arguments".
Step 2: Select your data file by choosing one of the following options, depending on the file to be opened:
Option A: Open a Cytoscape session file (.cys)
Go to File → Open.
- Select the session file and click Open.
Option B: Open a text or Excel file
Go to File → Import… → Network from Table (Text/MS Excel).
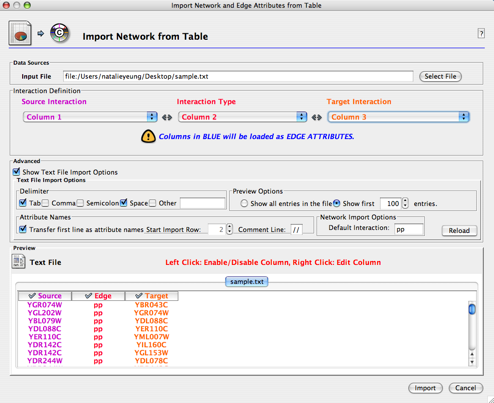
- A new screen will appear that allows you to define each data column in your file. Choose the file using the Select File button, and a preview of the file contents will appear as a guide at the bottom of the screen.
- Use the dropdown lists provided to define the appropriate columns containing Source Nodes (purple), Interaction/Edge Type, (red), and Target Nodes (orange). The preview will colour-code each column accordingly; blue is used to indicate columns that will be defined as edge attributes. Node attributes must be imported separately. If you have columns that you do not wish to load, you can disable them by clicking on the header ("Column X") in the preview.
See also "Import Free-Format Table Files", "Node and Edge Attributes"
- Edge attributes can be subdelimited within a column by right-clicking on the column header and selecting the List option as the Attribute Data Type. Select or enter the appropriate List Delimiter and click OK. Note that this subdelimiter must be different from the delimiter used to separate columns.
Troubleshooting: If Cytoscape is not parsing your text file correctly, you may need to change the advanced settings. Check the box marked Show Text File Import Options to display these settings. A Reload button is provided to refresh the preview once changes are made.
- Text is separated into columns incorrectly: Check which delimiter(s) is/are being used. The default settings are Tab and Space.
- The first lines of the file should not be imported: Skip unwanted line(s) by changing the Start Import Row value to the first row number of relevant data.
- The first imported line of the file contains column names: Check the box marked Transfer first line as attribute names to change the generic column names to those in the file.
- The file contains comment lines: Type the appropriate characters in the Comment Line field to skip all rows starting with this string.
The file contains multiple columns of target nodes: This is not a valid text file format. Try converting your file to the .sif format or an Excel spreadsheet (see "Supported Network File Formats").
- For Excel users: Only single-sheet workbooks are currently supported.
Option C: Open a different supported network filetype (SIF, GML, XGMML, SBML, PSI-MI, BioPAX)
Go to File → Import → Network (Multiple File Types).
For more about the different file types, see "Supported Network File Formats"
- If the file you are trying to open is stored on your computer, select Local Data Source Type (this is the default) and choose the file using the Select button. Selecting Remote Data Source Type allows you to load files from the Internet by typing in the URL or using Cytoscape bookmarks.
See also "URL import", "Managing Bookmarks"
New! Option D: Import Network from External Database
From verion 2.6.0, Cytoscape have direct access to external databases such as PathwayCommons or IntAct. In the following example, you will learn how to import network data from IntAct database.
Select File → Import → Network from web services...
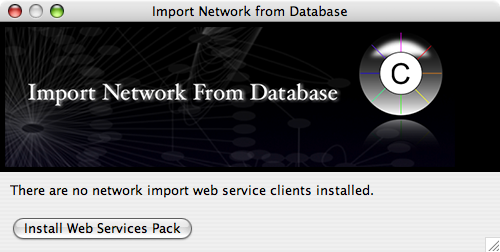
By default, no Web Service Client are installed. You can install some of the useful clients at once by pressing install Web Services Pack button. This process takes some time to finish since size of some client plugins are large.
Restart Cytoscape and select File → Import → Network from web services...
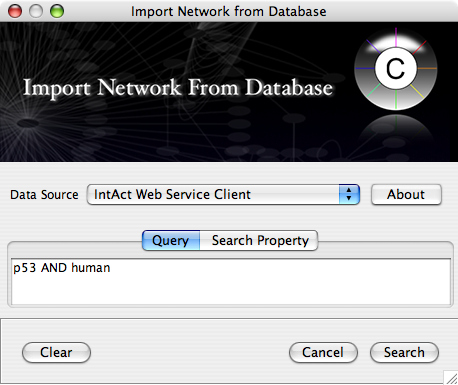
For Data Source, select IntAct Web Service Client.
On the Query box, type p53 AND human, then press Search
You will be asked to name your new network. Type p53 human from IntAct.
Select Layout → yFiles → Organic.
- Now you can see the network image similar to the following:
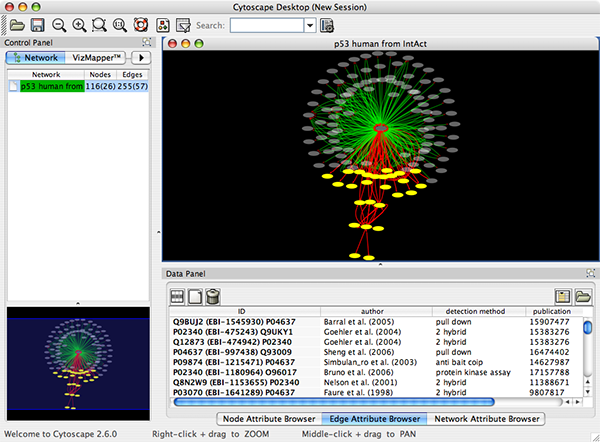
Some of the network import clients import attributes at the same time. For example, IntAct Client imports node and edge attributes including interaction detection method, GO terms, and publication data. These attributes are useful to filter or visualize network (See the example below). You will learn how to filter and visualize networks later in this tutorial.
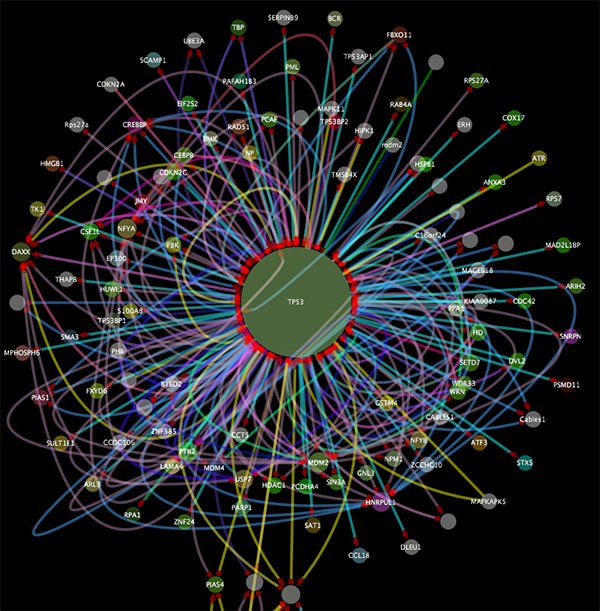
Step 3: Click Import to load the network. Cytoscape will display a progress screen as it loads your data. Check that the status is successful, then click Close.
Step 4: You can repeat Part 1 multiple times; that is, you can load many networks in separate Cytoscape windows. To switch between networks, click on the filenames at the left-hand side of the screen.
Part 2: Viewing Your Network
Step 1: If a network is not displayed after successful loading of your data, create a view of your network by going to Edit → Create View. Small networks will have a view automatically created when they are loaded, while large networks (i.e. thousands of nodes and edges) will be loaded without a view. Larger networks will be slower and harder to work with, due to their need for greater computational resources. However, they can be reduced to a selected subset of nodes and edges using the Filters function and then viewed as a smaller network.
See also "Filters"
Step 2: Apply a layout using the Layout menu. Applying a layout to a network moves the positions of nodes and edges to reduce overlap and provide a clearer visual representation of the data.
- The Rotate and Scale functions can be applied to the whole network or a subset of it, while Align and Distribute requires some or all nodes to be selected. To select nodes, click on each one while holding down the Shift key or click and drag to select an area containing a subset of the graph.
- The three categories of automatic layouts (yFiles, Cytoscape Layouts, and JGraph Layouts) all operate on the entire network.
- You can also manually lay out your network by selecting single or multiple nodes and dragging them across the screen.
Step 3: Adjust the viewing magnification of your network. There are five navigation tools:
- Zoom out (magnifying glass with a – sign)
- Zoom in (magnifying glass with a + sign)
- Zoom a selected region (magnifying glass with a dotted rectangle): zoom in on a selected subset of the network.
- View entire network (magnifying glass labelled 1:1): automatically change the magnification so that the entire network can be seen at once.
- Panning across the network: view different portions of the network. This can be done by clicking and dragging the blue box shown in the Network Overview in the lower left-hand corner of Cytoscape.
See also “Navigation and Layout”
Part 3: Saving Your Network
Step 1: Save your network using the Save or Save As… options in the File menu. This saves your network as a Cytoscape-specific .cys file, which you can then open for further viewing or editing at a later time. You can also share these Cytoscape session files with collaborators, allowing them to use the network as well.
Step 2: You can export your network as an image using File → Export → Network As Graphics. Other options available include exporting your network as an interaction data file for use in other software packages.
Step 3: Exit Cytoscape by selecting File → Quit.
What Next?
Cytoscape is a powerful graphics editor and many complex procedures are described in the user manual. Here are a few of the tasks Cytoscape is capable of performing:
change colours, shapes, and labels of nodes and edges (see “Visual Styles”)
colour nodes in gradients according to their properties, such as gene expression levels (see “Visual Styles”)
automatically select nodes or edges that meet a certain criteria (see “Finding and Filtering Nodes and Edges”)
annotate biological data with Gene Ontology (GO) information (see “Annotation”)
construct new networks from cPath searches using New → Network → Construct from cPath
retrieve additional information about a node from Internet databases by right-clicking on it (see “Linkout”)
As an open-source project, many Cytoscape users have contributed plugins that extend Cytoscape's functionality. These plugins and their descriptions can be found online at http://cytoscape.org/plugins2.php and are downloadable free of charge. The plugins have been grouped into five general categories:
- network analysis
- file import and export
- network inference
- functional enrichment
- communication and scripting
Return to the Cytoscape tutorials page.

