Cytoscape is a project dedicated to building open-source network visualization and analysis software. A software "Core" provides basic functionality to layout and query the network and to visually integrate the network with state data. The Core is extensible through a plug-in architecture, allowing rapid development of additional computational analyses and features.
Cytoscape's roots are in Systems Biology, where it is used for integrating biomolecular interaction networks with high-throughput expression data and other molecular state information. Although applicable to any system of molecular components and interactions, Cytoscape is most powerful when used in conjunction with large databases of protein-protein, protein-DNA, and genetic interactions that are increasingly available for humans and model organisms. Cytoscape allows the visual integration of the network with expression profiles, phenotypes, and other molecular state information, and links the network to databases of functional annotations.
The central organizing metaphor of Cytoscape is a network (graph), with genes, proteins, and molecules represented as nodes and interactions represented as links, i.e. edges, between nodes.
Development
Cytoscape is a collaborative project between the Institute for Systems Biology (Leroy Hood lab), the University of California San Diego (Trey Ideker lab), Memorial Sloan-Kettering Cancer Center (Chris Sander lab), the Institut Pasteur (Benno Schwikowski lab), Agilent Technologies (Annette Adler lab) and the University of California, San Francisco (Bruce Conklin lab).
Visit http://www.cytoscape.org for more information.
License
Cytoscape is protected under the GNU LGPL (Lesser General Public License). The License is included as an appendix to this manual, but can also be found online: http://www.gnu.org/copyleft/lesser.txt. Cytoscape also includes a number of other open source libraries, which are detailed in the Cytoscape_User_Manual/Acknowledgements below.
What’s New in @version@
Cytoscape version @version@ contains several new features, plus improvements to the performance and usability of the software.
Node Custom Graphics


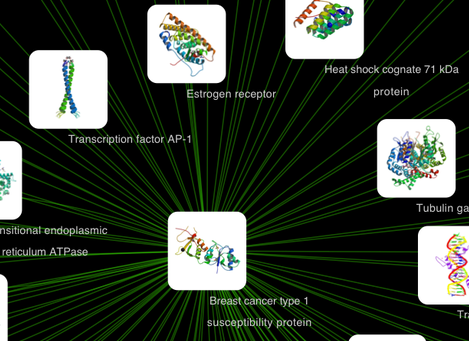
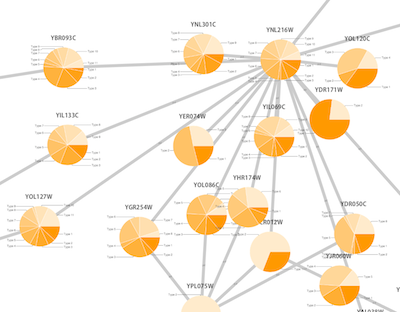
Internally, Cytoscape has Custom Graphics API for developers since 2.3. From this version, end-users can access this feature from standard VizMap GUI. You can add up to nine Custom Graphics objects per node. Each Custom Graphics object has position Visual Property and you can adjust its position from intuitive GUI.
Attribute Functions
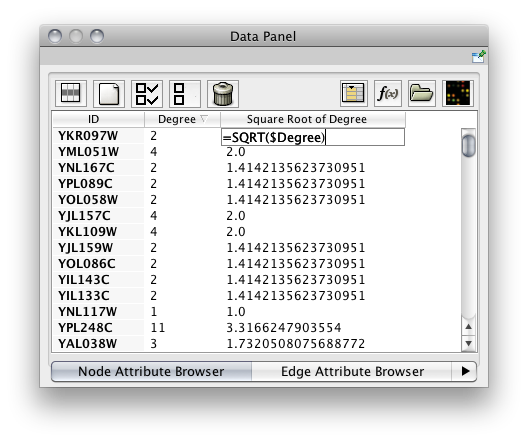
Attribute values can now be spreadsheet-like formulas. In particular, an attribute on a node/edge can reference other attributes on the same node/edge. About 40 built-in functions have been provided and it is relatively easy to implement a Cytoscape plug-in of your own to add additional functions. (An example plug-in can be found with the other plug-in tutorials.) Arbitrarily complex arithmetic, string and logical/boolean expressions are supported as well as limited list construction. The syntax closely follows that of Microsoft Exceltm.
Other New Features and Bug Fixes
- Plugin search: you can now search plugins by keyword(s).
- Many, many bug fixes!
Please Cite Cytoscape!
Cytoscape is a non-profit, open source project. To help make the Cytoscape project sustainable, your support is essential! Since Cytoscape project depends on government/private grants, citation is the most important support for us. When you publish papers/books/posters, please cite the following paper:
- Shannon P, Markiel A, Ozier O, Baliga NS, Wang JT, Ramage D, Amin N, Schwikowski B, Ideker T.
Cytoscape: a software environment for integrated models of biomolecular interaction networks.
Genome Research 2003 Nov; 13(11):2498-504
