RFC Name : Group views |
Editor(s): Anna Rukosuyeva |
Status: Being written |
Contents
Proposal
The goal is to provide different ways of viewing a group of nodes of a network. We must provide a visualization that will present nodes with specific characteristics or similarities in a clear and organized manner without intrusion on the view of the rest of the network.
To accomplish this goal we will introduce use cases that will present a different type of group view that will provide an option for this feature.
Biological Questions / Use Cases
1 - Group View
This tool will provide the ability to group together nodes and edges of a network and view them in a clear and organized manner. The group view can have multiple ways of representing the grouped nodes and fall into two categories described. Only one group view can be active at a time but the user will have the ability to change between different views at any time.
1a) Child Nodes Hidden
Solution: A group of nodes can be visualized by collapsing the selected group (child nodes) into a single parent node. The connections that exist between the child nodes and the surrounding nodes of the network will be represented in this view. All the edges connected to the child nodes will be connected to the single parent node. The group node will have the option of having specific characteristics that will help in representing the data attributes of the child nodes as visual attributes of the group node.
Average: The parent node can inherit a color that will be more helpful in representing the child nodes within. This can be done by using a color value that is an average of all the color values of the child nodes. Similarly, the following node visual attributes can be averaged this way: Node Border Color, Node Border Opacity, Node Font Size, Node Height, Node Label Color, Node Label Opacity, Node Label Position, Node Line Width, Node Opacity, Node Shape, Node Size, Node Width.

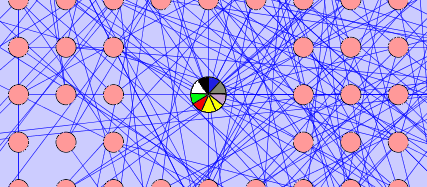
Pie Node: The group characteristics can also be represented by a pie node. The pie chart can show segments of the colors that the child nodes represent, the size of each segment will be representative of how often that color appears in the child nodes. An implementation of this idea exists and can be found at: http://genepro.ccb.sickkids.ca/screenshots.html
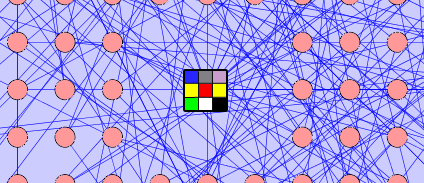
Grid Node: The group characteristics can also be represented by a grid node. The cells of the grid node can represent each colour that appears in the child nodes of the group. The grid node will appear as a square shape with a square grid inside.
- Aside from node colour, the Grid and Pie nodes can also visualize the following node visual attributes: Node Border Color, Node Border Opacity, Node Font Size, Node Height, Node Label Color, Node Label Opacity, Node Line Width, Node Opacity, Node Shape, Node Size, Node Width.
Multiple Attributes: Another way to represent the group characteristics is to use more than one visual attribute for a more comprehensive visualization of the children nodes. For example, the parent node can represent the colour variations of the child nodes by an average colour and the thickness of the node border can map to the total number of nodes that the group node represents.
Custom Graphics: The user will have the ability to create custom graphics by combining various graphics and be able to render the group node view. The use case for this tool can be found here http://www.cytoscape.org/cgi-bin/moin.cgi/groupAPI/UseCase_10A
Use Cases:
1."Clustering-Biomodules" - http://www.cytoscape.org/cgi-bin/moin.cgi/groupAPI/UseCase_1
2."Protein Complexes–Pico/GenMAPP" - http://www.cytoscape.org/cgi-bin/moin.cgi/groupAPI/UseCase_2A
3."Black box pathways" - http://www.cytoscape.org/cgi-bin/moin.cgi/groupAPI/UseCase8
Allan Kuchinsky, October 13, 2007: An alternative to showing the distinct attribute values of all child nodes would be to use just two visual attributes: one to represent a measure of centrality, such as arithmetic mean, and one to represent a measure of variability, such as standard deviation. I think that the multiple color node requires the user to conciously decode the colors to interpret attribute values, rather than to just pick up easily noticeable patterns. So, it shifts the visualization from the perceptual to the cognitive domain, which makes it much less effective.
1b. Child Nodes Visible
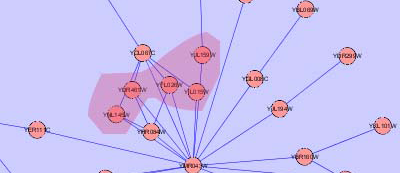
Solution: A group of nodes can be visualized by a bounding box. This box will have the ability to move around and as a result move the child nodes along with it. Surrounding nodes of the network can then be dragged and dropped into the bounding box and will behave as child nodes. All the child nodes will be clearly visible along with their characteristics as they were before the grouping. The characteristics of the bounding box can change to reflect different characteristics of the group nodes.
Allan Kuchinsky: October 13, 2007: Should we allow the user to remove child nodes by dragging them out of the bounding box? If so, then under what conditions should we allow this?
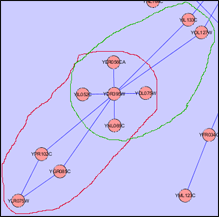
Adaptive boundary: The shape of the bounding box can change to the shape that the grouped nodes make. This will allow easy grouping and visualization when there are many surrounding nodes in the network. Different types of groups can be represented by a shape of a different colour.
Set Shapes: The bounding box can have different appearances that can represent different types of groups (from a biological standpoint). For example the bounding box may appear as a simple rectangular frame or a circle or a set of brackets, and a legend can explain the associations.
Box Width: The width of the border of the bounding box can change with the number of nodes that are inside the group.
Box Location: To avoid clutter and show a clear distinction between the grouped nodes and the rest of the network, the bounded group should be moved to a separate, empty part of the network panel.
An implementation of this idea named the “Bubble Router” can be found at: http://conklinwolf.ucsf.edu/genmappwiki/Bubble_Router_Plugin
Use Case:
1."Named list of genes. Piet & GenMAPP" - http://www.cytoscape.org/cgi-bin/moin.cgi/groupAPI/UseCase_7A
Stacked View: After expanding the grouped nodes, show the child nodes as vertically stacked. During stacked view, different sections of a single node can be viewed and each section of the node will have edges connected to it. Each section of the node will be presented by a block and each block will be stacked on top of each other to represent a single node. Each block can be differentiated with a name and a separate color.
Use Case: "Paralogs" - http://www.cytoscape.org/cgi-bin/moin.cgi/groupAPI/UseCase_5A
2 - Group Window View
This is an optional, independent view of the group nodes that can be active during any of the above group views.
New Window: After expanding the grouped nodes, show the child nodes as a new network in a separate window. A “+’ symbol will appear when the mouse is moved over a parent node and when clicked, a new network window pop-up that will show the child nodes as a new network. The pop-up window can also be activated using a right-click menu.
Use Case: One idea for implementing this view can be found here http://www.cytoscape.org/cgi-bin/moin.cgi/groupAPI/UseCase_3A
Use Case: "Protein superfamily networks" Use Case 6 from http://www.cytoscape.org/cgi-bin/moin.cgi/groupAPI
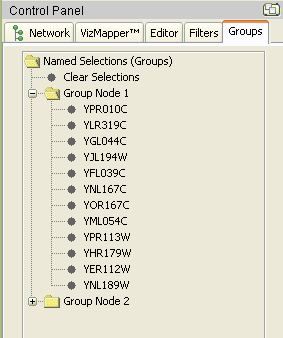
Group Panel: For each grouped visualization described above, create a group panel in Cytoscape that will show a more detailed, hierarchical structure of the group. This panel will be very helpful when the groups become more complex with multiple levels of parent nodes. The parent node will be listed in the panel with all the child nodes and their characteristics branching from it. This view will be very similar to Windows Explorer that shows the file hierarchy. One example of this functionality is the Group Panel in the current Named Selection plugin shown below.
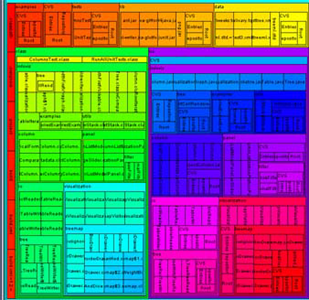
Tree Map: A hierarchical node grouping can be flattened out and shown as a birds-eye, textual representation. This view will work for groups that can be represented by strict trees, ie: only one parent per node and would only be useful for highly nested structures. Directed acyclic graphs (DAG) will not be supported by this view. Visual Aid: An example of this visualization taken from http://ivtk.sourceforge.net/
Allan Kuchinsky, October 13th, 2007: TreeMaps are really an extension of Pie Charts, so make sense when you want to show the relative values for different child nodes. They really only make sense if you have a highly nested data structure. Given such a data structure, TreeMaps provide strong visual cues and might be an alternative to Pie Nodes and Grid Nodes.
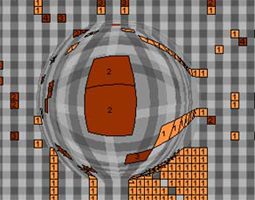
Mouse-Over Tool: Create a viewing tool that will be controlled by a mouse and will travel over the network panel, when the tool moves over a parent node, the inside of the parent node.This tool will show an “x-ray”, detailed view of the inside of the parent node. In order for this tool to be useful, the "x-ray" area should move over the nodes smoothly and the updated view should be instant, without any latency. Visual Aid: An example of this type of tool can be seen here. However instead of a zoomed view, the user will be able to see the child nodes that are inside the parent node. Image taken from http://ivtk.sourceforge.net/
Allan Kuchinsky, October 13, 2007: Using distortion might be a very intuitive way to give the user a quick overview of the children of a parent node. Coordinating this display with the Cytoscape renderer may be a challenge. Also, performance will be an important consideration. The user should be able to move the magnified area smoothly, the display should update immediately -- there should be no perceivable latency.
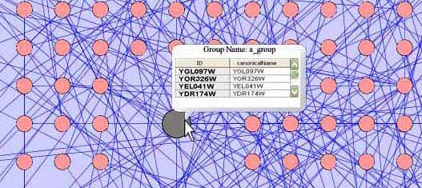
Tool Tip: The user can have the ability to view information within the node without expanding the group node. A tool tip window can appear when a cursor moves over the group node and a list of names of all the child nodes can appear in the window. Other important information can also appear in this window, such as a list (or a percentage figure if the number child nodes is large) of the type of nodes that exist in this group or other features such as color if necessary.
General Notes
Some interesting ideas about group nodes can be found in a document found here http://www.nature.com/nbt/journal/v25/n5/pdf/nbt1304.pdf
Converting Between Visualizations
- The user should be able to convert from one type of a visualization to another with a simple mouse click.
Average Node Grouping
- Another feature that can be considered in this grouping is the placement of the group node. The center of mass of the newly created group mode can vary depending on the size of the child nodes ie. larger child nodes would pull the group node closer to their direction. This feature has been implemented already.
Group view layout
There should be a layout for the graph that contains the group nodes as well as a layout for the child nodes. These layouts could be different and the layout engine would apply them automatically in a hierarchical fashion when the children nodes are visible in the network. This idea should be discussed in more detail as a separate RFC. One specific use case would be layout of biological pathways where network motifs (e.g. a biochemical reaction) is represented as a group, then the groups are layed out, then the groups/motifs are layed out as they would be in a textbook e.g. biochemical reactions would be viewed as they are in textbooks (substrates on one side, products on the other, enzymes in the middle). This would include the ability to apply a standard layout to members of a group and view the result. This functionality is implemented in Biochemical reactions using HyperEdges, http://www.cytoscape.org/cgi-bin/moin.cgi/EditingBiochemicalReactions
Allan Kuchinsky, October 13, 2007: I believe that this functionality is implemented by HyperEdges. See the wiki page entitled EditingBiochemical Reactions.
Implementation Notes
- There are three factors that are going to be governing the order in which the above features are implemented as well as the decision whether some of the features are going to make it into the implementation phase at all. These factors are as follows: Complexity, Dependency and User Need.
Complexity: Many of the above features would be easier to implement than others. These features would be best implemented first since not a lot of time would be needed and they can serve as the foundation. By implementing the simpler features, it would be clear how the functionality will be integrated into the existing system and how the more elaborate features will be later developed.
Dependency: This factor comes hand in hand with complexity. The more elaborate features are most likely build on top of the simpler designs.
User Need: Some of the above features may have more priority over others and therefore should be developed first.
Open Issues
Mapping Node Attributes to Nodes
- How should the attributes of the grouped child nodes be mapped to the parent node?
Mapping Edge Attributes
- Should attributes of edges that are contained within a group be mapped to the edges of the parent node. If so, how?
Sharing Child Nodes
- Problems may arise when two or more parent nodes share the same child nodes. How should those child nodes be grouped and visualized?
Different Data Attributes
- If the group node has data attributes that are different than the children data attributes, how should they be mapped to group node visual attributes? Should we allow the user to switch to a group node view that supports normal data to visual attribute mapping for the group node without considering the children nodes?
Removing nodes from Group
- When using the bounding box visualization should the user be able to remove nodes by dragging them out of the bounding box? If yes, there should be a differentiation between moving nodes out of the box or simply moving nodes further apart within the bounding box. Perhaps a menu box pops up when a user moves a node outside the box to select whether to put the node outside the box or shift the box around the new position.
Overlapping groups
- With any of the above visualizations, a problem may arise when 2 or more groups share the same nodes. To solve this problem, we will focus on the two visualization currently discussed in the Implementation Plan - Child Nodes Hidden and Child Nodes Visible (bounding box).
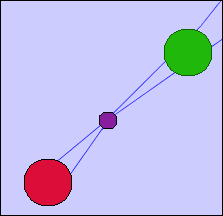
Child Nodes Hidden: One possible solution to overlapped groups is to create a node that represents all the shared nodes. In this case, parent nodes will be created for each group. These nodes will represent all the child nodes of that group that are independent of all other groups - ie. are not shared by any other group. A new node will then be created that contains all the nodes that are shared by the groups. This node will be located between the parent nodes and will be significantly smaller in size to distinguish it from the parent nodes.
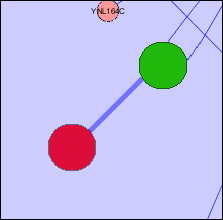
- Another possible solution to this problem is to join that group nodes that share nodes with an edge. The thickness of the edge will correspond to the total number of nodes that the group nodes share.
- An example of both solutions is presented in the following images for a more comprehensive explanation.
- There could be a case when all nodes of one group are contained within another group. In this case, this problem can be solved by creating a group node for both groups, but positioning one node inside the other.
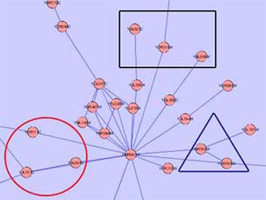
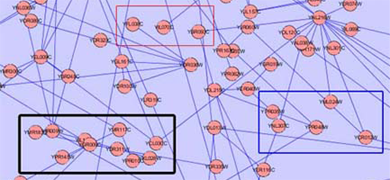
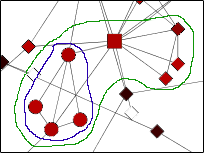
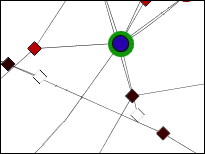
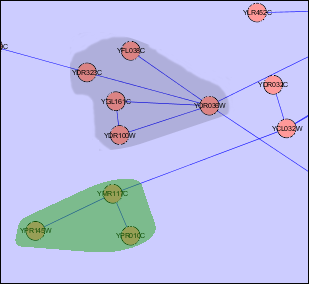
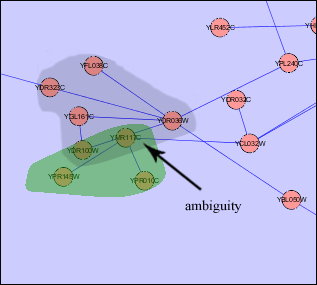
Child Nodes Visible: Overlapping groups present a problem in this visualization as well. Shared nodes can be represented by overlapping the bounding boxes of the groups over the shared nodes. This way all shared nodes between the 2 groups will be contained within both bounding boxes. A problem arises in this situation because the overlapped bounding boxes create a colour which is a combination of both bounding boxes. This presents the illusion of the shared nodes existing in their own group surrounded by their own bounding box. This ambiguity will be solved once the user tries shifting one of the bounding boxes and will notice that the other bounding box moves along with it. This situation will also occur if two groups are located very close to each other in the network. This will cause the bounding boxes to overlap and any nodes that may be contained within this overlap will present the illusion of being in their own group. One possible solution to this problem is to implement an intersection mechanism. This way if two groups (which do not share nodes between each other) are moved close together, they do not create overlapped colours that create the illusion of a new bounding box, instead one of the bounding boxes will dominate and overlap the other. In the images below, we can see ambiguity when the two bounding boxes are moved close together.
Implementation Plan
Based on the above mentioned factors to determine the order in which the features will be implemented, the current phase of development will focus on Use Case “Clustering-Biomodules” and Use Case 2 “Protein Complexes”. These use cases are currently implemented in Cytoscape with “Mcode” plugin for Use Case 1 and “BioPax” plugin for Use Case 2.
Mcode
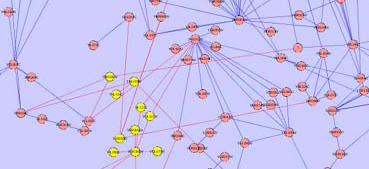
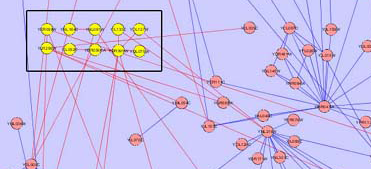
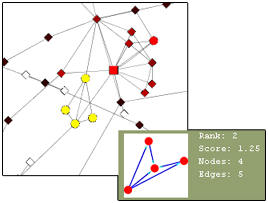
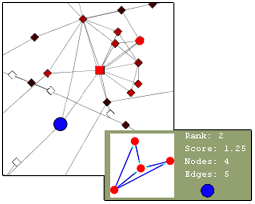
This plugin finds different types of clusters of nodes and edges that are very useful in analyzing a network. The group node functionality would be very useful for this plugin as it would create a more simple and organized appearance. The user can find the cluster of interest and choose to group it into a single group node and expand it back into the cluster form. Below is an illustration of the current Mcode cluster without and with the group node functionality.
Complexities
Threshold: Mcode has one very important complexity – the threshold. This value can be increased to include more nodes in the cluster or decreased to exclude nodes from the cluster. As this value is changed, current cluster(s) of the network is automatically updated to include/exclude more nodes and the image of the new cluster is also updated. When this happens, the group node must also update to include/exclude the new nodes. As the threshold value increases, surrounding nodes will be “pulled into” the group node and will disappear from the network. Similarly, as the threshold value decreases, the excluded nodes will be “thrown out” of the group node back into the network. This change should be done quickly and seamlessly.
Overlapping Groups: As the value of the threshold is increased, another complexity may arise – overlapping groups. As one cluster increases, it may expand so much that it will engulf nodes that are already part of an existing grouped cluster.
BioPax
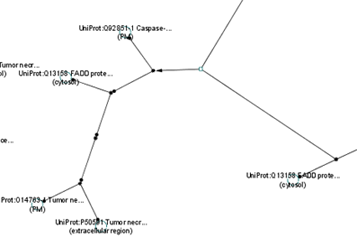
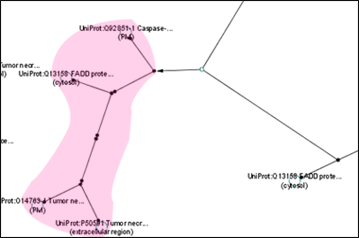
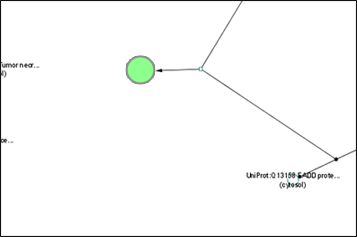
This plugin was developed to recognize different file types for importing current networks. The group node functionality becomes very useful when dealing with protein complexes. Currently, Biochemical reaction is represented by a single small node and an arrow node that points to a large protein complex. This large and complicated protein complex can be condensed into a single group node for a more organized, collapsed view. During expanded view, the protein complexes can be further distinguished by a coloured bounding box. The image below shows the current BioPax view of a protein complex as well as the proposed expanded and compressed views.
Convex Hull
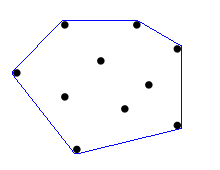
The Convex Hull algorithm is very useful in the implementation of the bounding box visualization. This algorithm implements an "elastic band" that is stretched out to encompass the selected nodes and assumes the shape of the outside nodes. For implementing the bounding box visualization for Cytoscape, the Convex Hull algorithm would have to be modified to soften the edges around the outside nodes and create a larger perimeter to allow some space between outside nodes and the bounding box. For more information about the Convex Hull, view the 2D demonstration as http://www.cse.unsw.edu.au/~lambert/java/3d/hull.html
Comments
How to Comment
Edit the page and add your comments under the provided header. By adding your ideas to the Wiki directly, we can more easily organize everyone's ideas, and keep clear records. Be sure to include today's date and your name for each comment. Try to keep your comments as concrete and constructive as possible. For example, if you find a part of the RFC makes no sense, please say so, but don't stop there. Take the extra step and propose alternatives.
Allan Kuchinsky -- October 13, 2007: I added some comments inline.
