Launch and Debug your App using Eclipse
Overview
This page describes:
- How to launch Cytoscape with your App from inside Eclipse.
- How to debug your app using the Eclipse debugger.
Launching Cytoscape from inside Eclipse
Click on the little arrow next to the External Tools toolbar button and select External Tools Configurations... from the dropdown menu.
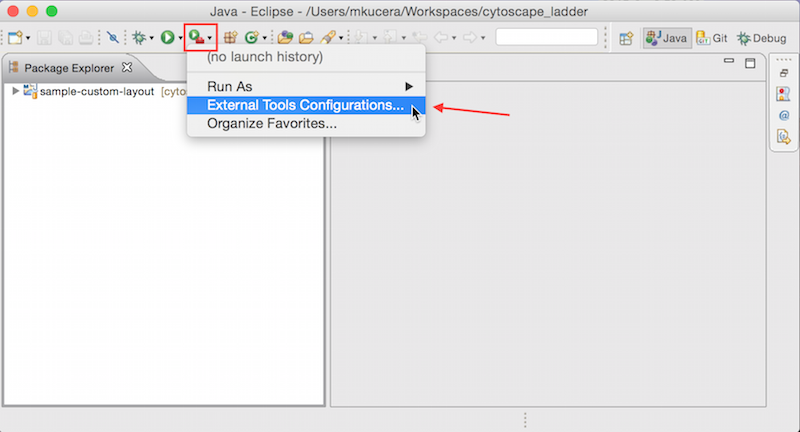
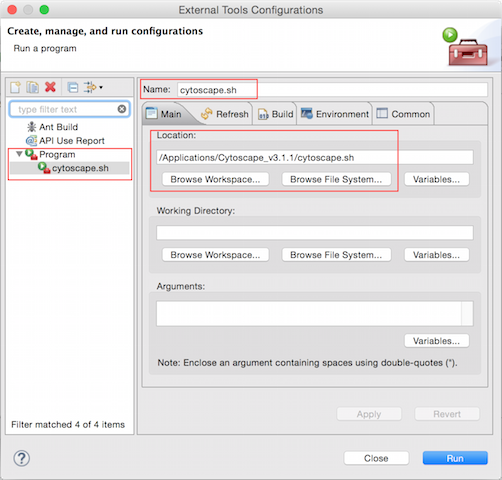
In the dialog double click on Program on the left. This will create a new launch configuration.
Change the name to cytoscape.sh (or cytoscape.bat if you are on Windows).
Under Location click the Browse file system... button.
- Navigate to the location of your Cytoscape installation.
Select the cytoscape.sh file (or cytoscape.bat if you are on Windows).
Click Apply then click Run.
Cytoscape should launch and you should see the console output in the Console View.
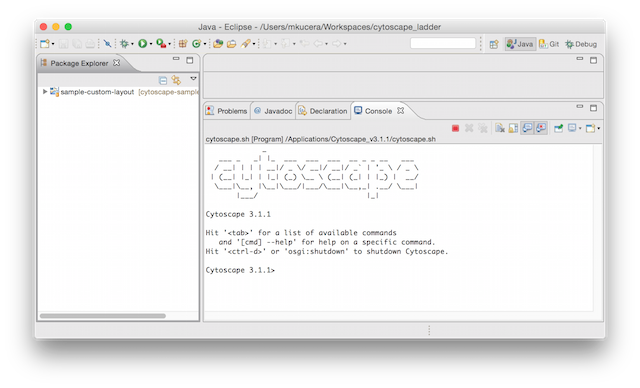
Any time you want to launch Cytoscape click on the External Tools toolbar button.
Debugging your App
Any time you want to debug your app you need to do two things:
- Lauch Cytoscape in debug mode.
- Connect to the Cytoscape process from the Eclipse debugger.
Launching Cytoscape in Debug mode
To start Cytoscape in debug mode from the console, run Cytoscape with debug as the first command line argument:
In Windows: cytoscape.bat debug
In Linux/Mac: ./cytoscape.sh debug
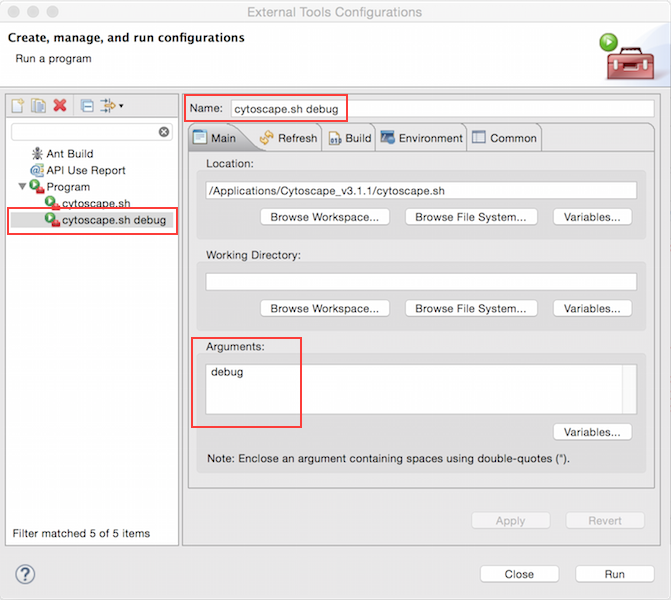
To start Cytoscape in debug mode from inside Eclipse create another external tool launch configuration like the one created above.
Click on the little arrow next to the External Tools toolbar button and select External Tools Configurations... from the dropdown menu.
Right click on the cytoscape.sh launch configuration that you have already created and select Duplicate.
Change the name to cytoscape.sh debug .
Under Arguments add debug.
Click Apply then click Run.
The message Listening for transport dt_socket at address: 12345 will appear in the console. The Cytoscape process is blocked waiting for a connection from an external debugger.
Connecting to Cytoscape with the Eclipse Debugger
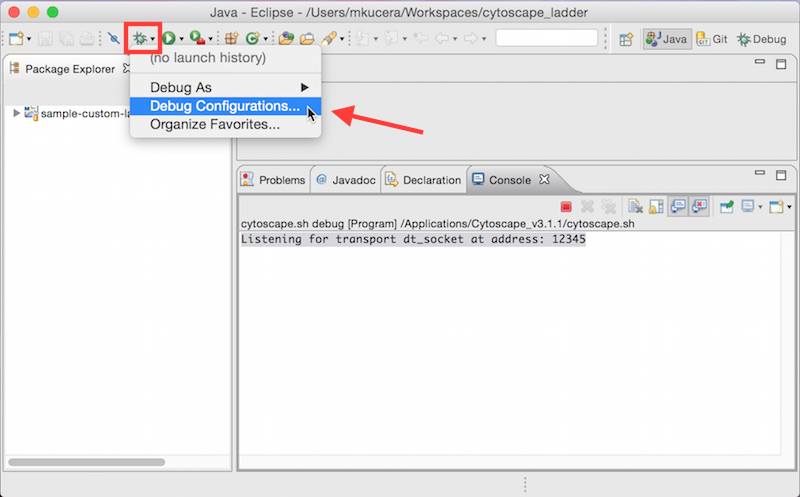
Click on the little arrow next to the Debug toolbar button and select Debug Configurations....
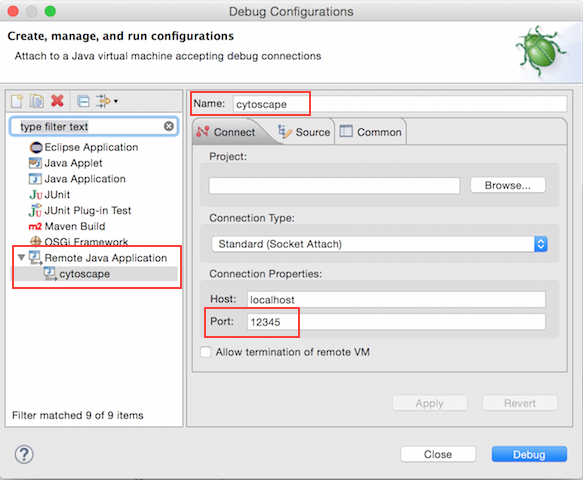
Double click Remote Java Application.
Change the name to cytoscape.
Under Port enter 12345.
Click Debug.
Switch to the debug perspective, go to the main menu and select Window > Open Perspective > Other > Debug. You should see Cytoscape running in the debug view.
The Eclipse Debugger
Here is a nice tutorial on how to use the Eclipse debugger: http://www.vogella.com/tutorials/EclipseDebugging/article.html
The Eclipse Java debugger supports a very nice feature called Hotswap. The debugger allows you to make changes to your code, compile them and run them without leaving the debugger or needing to restart Cytoscape. Simply edit some code and save the file and the new code should replace the old code in the debug session. Keep in mind that this only works with edits that do not change top level declarations. For example if you add a parameter to a public method or add a field to a class then the debugger will inform you that it cannot replace the old code. When this happens you will have start a new debug session.
Troubleshooting
It is important to disconnect the debugging process when finishing executing Cytoscape. This will happen naturally when the program exits gracefully, but during the debug process, it is common to terminate execution without going through the proper quit procedure. As a result, this can leave an orphaned process listening on port 12345. The next time you try to execute you’ll see an error at start up as you attempt to open a second connection on the same port.
ERROR: transport error 202: bind failed: Address already in use
ERROR: JDWP Transport dt_socket failed to initialize, TRANSPORT_INIT(510)
JDWP exit error AGENT_ERROR_TRANSPORT_INIT(197): No transports initialized [debugInit.c:750]
FATAL ERROR in native method: JDWP No transports initialized, jvmtiError=AGENT_ERROR_TRANSPORT_INIT(197)
/Applications/Cytoscape_v3.5.0-RC2/cytoscape.sh: line 80:  3052 Abort trap: 6           $script_path/framework/bin/karaf "$@"
For Mac / Linux / Unix users:
If you encounter this error, you can query the list of open files (lsof) that are listening to a our debug TCP port with this command from a terminal:
lsof -t -i :12345
To quickly find and kill the process that is causing the problem, you can run:
kill -9 $(lsof -t -i :12345)
For Windows users:
netstat -aon | findstr :12345
taskkill /F /PID XXX (where XXX is replaced by the process id)