Control Cytoscape from R Console
Introduction
CytoscapeRPC is a plugin for Cytoscape to use Cytoscape as a RPC server. You can call Cytoscape functions from variety of languages including Perl, Python, Ruby, and R. In this tutorial, you learn how to use Cytoscape from R console.
Setup
You need to install the following plugins/packages.
Cytoscape Plugin
Just copy the following jar files to Cytoscape plugin directory.
Required files are in lib directory: xmlrpc-common-3.1.3.jar, xmlrpc-server-3.1.3.jar, ws-commons-util-1.0.2.jar
R Packages
XML-RPC package XMLRPC_0.2-mod.zip (Bug fix version by Paul Shannon. BSD License)
igraph graph utility package
Tutorial
Start Cytoscape RPC
Start Cytoscape. If you want to see the all messages (including Exceptions from CytoscapeRPC plugin), start Cytoscape from command line (by executing cytoscape.sh or cytoscape.bat)
Select Plugins-->CytoscapeRPC-->Activate RPC
- Modify port number if necessary. Default port is 9000.
Start R
- Start R console
- Load required libraries
> library(igraph)
> library(XMLRPC)
- Test RPC Plugin.
> testResponse = xml.rpc('http://localhost:9000', 'Cytoscape.test')
> testResponse
[1] "It works!"
Create Network with igraph and Visualize It in Cytoscape
- Create an empty network.
> networkID = xml.rpc('http://localhost:9000', 'Cytoscape.createNetwork', 'R-Cytoscape Test')
> networkID
[1] "2"
> networkTitle = xml.rpc('http://localhost:9000', 'Cytoscape.getNetworkTitle', networkID)
> networkTitle
[1] "R-Cytoscape Test"
- Generate a scale-free graph according to the Barabasi-Albert model
> g1 <- barabasi.game(200)
> g1
Vertices: 200
Edges: 199
Directed: TRUE
Edges:

[0]     1 ->   0
[1]     2 ->   0
[2]     3 ->   1
.
.
.
- Create Cytoscape network from the generated graph
> edgelist1 <- get.edgelist(g1)
> edgelist1
       [,1] [,2]
  [1,]    1    0
  [2,]    2    0
  [3,]    3    1
.
.
.
> edgeIDs <- xml.rpc('http://localhost:9000', 'Cytoscape.createEdgesFromVector', edgelist1[,1], edgelist1[,2])
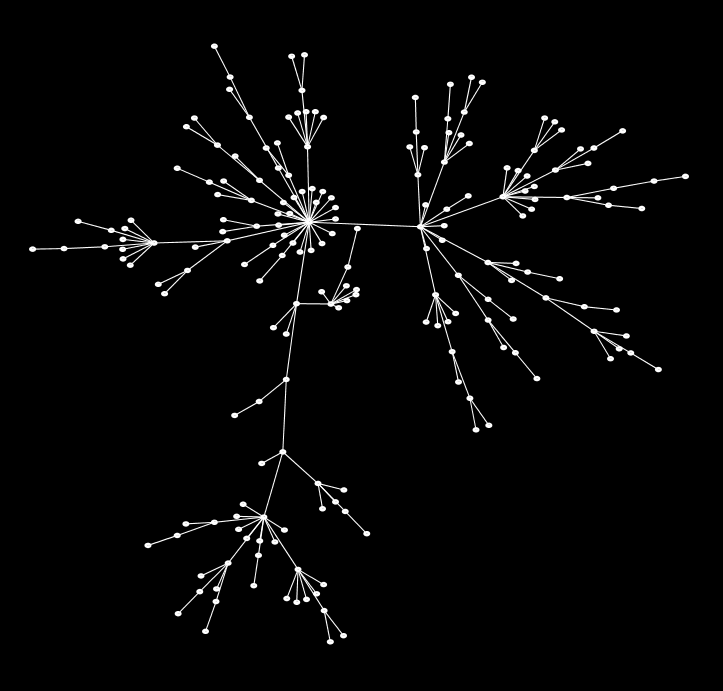
- In the Cytoscape window, you can see one red node. Actually, it's a graph with 200 nodes without any visual properties. After applying layout and vizmap, you can see something like this:
(to be continued...)
