Tutorial 1: Getting Started
Contents
This tutorial introduces basic network browsing and menu navigation. In this tutorial, you will learn about the following:
- Loading networks and generating network layouts
- Selecting and querying specific nodes and edges
- Setting visual properties
This tutorial and accompanying lectures were delivered at CSC, the Finnish IT center for science. The lecture slides of background material are available here and an accompanying video presentation is available courtesy of the CSC.
This tutorial features the RUAL.subset.sif dataset, a portion of a human interaction dataset published 2005 Oct 20 in Rual et al., Nature 437(7062):1173-8, available at http://www.cytoscape.org/cgi-bin/moin.cgi/Data_Sets/. Before starting, please download this dataset and its companion attribute file RUAL.na to your local computer by right-clicking on the links for the files and saving them.
Begin by clicking here: WEB START (approximate download size: 20 MB) This starts Cytoscape on your own computer, after downloading the program and annotations from our website. (On subsequent runs, the program and annotations will not be downloaded again unless we have new versions for you to use.) If Cytoscape does not start, please check the introductory tutorial page for some places to get help. If at any point you wish to restart this tutorial, just click again on the WEB START link.
Initial steps
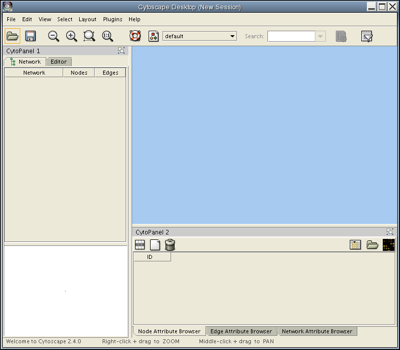
Launch Cytoscape. You should see a window that looks like this:
Load the RUAL.subset.sif network file into Cytoscape by selecting File → Import → Network(Multiple File Types)... , then click the Select button and specify the location of the file you just downloaded. This network consists of 1089 interactions observed between 419 human proteins, and is a small subset of a large human interaction dataset. This subset of interactions consist of proteins that interact with the transcription factor protein TP53. Now, your screen should look like this:
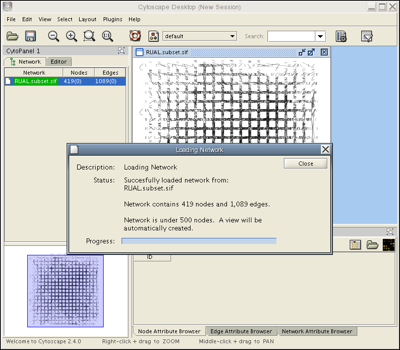
Webstart users only: If you see a network with square white nodes on a white background, locate the the Set Visual Style pull-down menu  and change the visual style from "default" to "Tutorial".
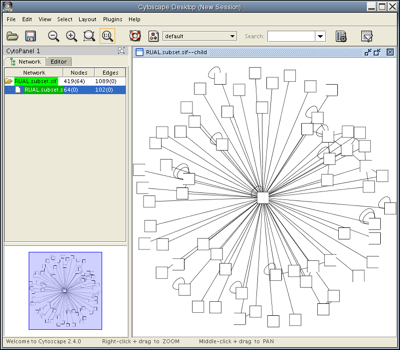
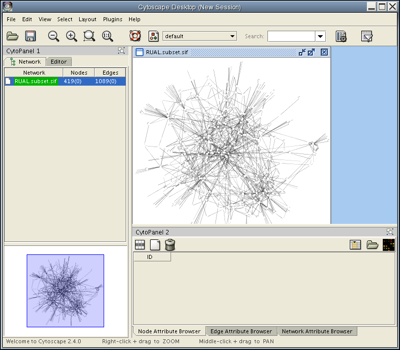
Click Close on the Loading Network popup window. Under the Layout menu, select Cytoscape Layouts → Spring Embedded→ All Nodes. After a brief calculation, your screen should look like this:
Selection
On the Cytoscape canvas (the blue window showing the network graphic), you can select single nodes by clicking on them with the mouse, or multiple nodes by holding down the left mouse button to select an area. Select a few nodes, and move them around the screen.
You can enable edge selection on the Cytoscape canvas by going to Select → Mouse Drag Selects → Edges (or Nodes and Edges). Select a few edges with the mouse by clicking on them directly, or using the mouse to define a select region that intersects them.
Cytopanel navigation
Notice that the very bottom of this network is hidden by the Data Panel. Move this panel into a separate window by clicking on the Float Window control in the upper right-hand corner of Data Panel: ![]()
Now, you should have two Cytoscape windows: the Cytoscape Desktop, and a new window labeled Data Panel, similar to the one shown below. This browser will display attributes of selected nodes. Select a few nodes.
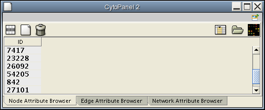
Notice that the Data Panel now has a Dock Window control: ![]() . Click on this control to dock the Data Panel, and then click on the Float control to un-dock it.
. Click on this control to dock the Data Panel, and then click on the Float control to un-dock it.
In your network window, locate the Maximize Window control  , and click on it to maximize your network window.
To center your network in this window, click on the View Entire Network icon  in the top menu bar.
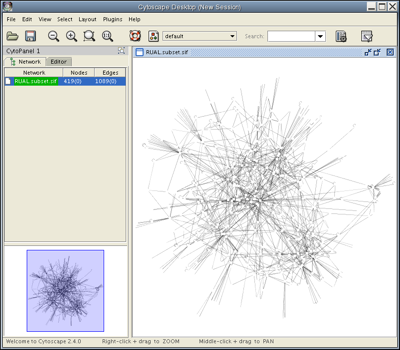
Your Cytoscape Desktop window should now appear as follows:
More on Node Selection
The nodes in this network are identified by numeric Entrez IDs. The node representing TP53 is numbered 7157. Select this node as follows:
- Under the Select menu, select Nodes → By Name.
- A popup window should appear labeled Select Nodes by Name.
- Enter 7157, and click Search.
The node in the center of the screen should turn yellow. Close the popup window. Un-select this node by clicking on the background of the Cytoscape canvas, and then type Ctrl-F. The Select Nodes by Name popup should reappear. Ctrl-F is a keyboard shortcut for selecting a node by name. Many Cytoscape menu options have keyboard shortcuts; they are listed at the right side of the pull-down menus. Re-select node 7157 (TP53).
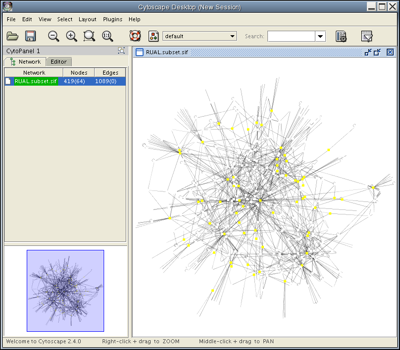
Select the nodes that interact directly with TP53 by going to Select → Nodes → First neighbors of selected nodes. You should see a network with several yellow nodes in the center, as shown. The Control Panel at the left side of the window indicates that of 419 nodes in your network, 64 are currently selected. Your network also contains 1089 edges, none of which are currently selected.
Copy the selected nodes and their edges into a separate network by selecting File → New → Network → From selected nodes, all edges.
Clean up your canvas:
- Maximize your subnetwork window.
- Go to Layout → Cytoscape Layouts → Spring Embedded → .
- Use the Zoom out to display all of current Network icon to zoom into this network.
Your display should now appear as shown.
Loading Node Attributes
The nodes of this network are identified by numeric IDs. Looking closely at these nodes, you will see their numeric labels. A companion attribute file maps these numeric IDs to standard gene names. Load this attribute file as follows:
- Go to File → Import → Node Attributes.
- Select the file RUAL.na, and click Open.
- A popup window labeled Loading Node Attributes will appear. When this window reports Status: Done, click Close.
Useful Tip: Look at the file RUAL.na with your favorite text editor to examine its format.
View these attributes in Cytoscape as follows:
Go to the Node Attribute Browser (Data Panel), and click on the Select Attributes button
 . A pull-down menu should appear, similar to the one shown:
 - In the pull-down menu, left-click on Official HUGO Symbol. Right-click to exit the menu.
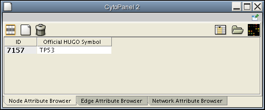
- Now, the Node Attribute Browser will show the IDs and official names of the nodes selected in this network. Click on Node 7157 at the center of the network window, and the Node Attribute Browser should appear as shown.
Defining visual styles
Now, we will modify the visual styles to display the official node names as node labels.
In the Cytoscape Desktop, click the Open VizMapper icon. The VizMapper will appear in the Control Panel to the left.
- In the Options drop-down menu, click Copy existing Visual style. Name this style Class 1.
In the Visual Mapping Browser in the VizMapper, click on the Node Label tab.
- Locate the first pull-down menu, and select Official HUGO Symbol.
The nodes should now be labeled with their official names.
Notice that you can switch quickly between visual styles using the Set Visual Properties pull-down menu. Switch between some of the pre-defined visual properties and watch how the canvas changes.
This dataset contains many types of edges: some representing experimentally-determined interactions (Y2H and coAP, from yeast two-hybrid and co-immunoprecipitation respectively), and some obtained from the literature (non_core, core, and hyper_core, corresponding to low, moderate, and high confidence literature search results). We will now represent each interaction by its type, as follows:
Return to the VizMapper to further define your Class1 visual style.
- Under the Visual Mapping Browser, click on the Edge Color tab.
- Go to the dropdown list for Mapping Type and select Discrete Mapping.
- In the Edge Color Drop-down, select interaction. A list should now appear listing the types of interactions in this network, including Y2H, coAP, core, hyper_core, non_core.
- Click the space next to Y2H and then click the small icon with three dots that appears. Select a color for the Y2H edges.
- Repeat for the other edge types. Select your colors so that the Y2H and coAP colors are similar (e.g. green and blue), and the core, hyper_core,and non_core colors are similar (e.g. orange, red, and pink). This will allow you to see if each edge was determined experimentally or through literature, and will further allow you to see the edge type. Your Set Visual Properties window should now look similar to the one shown below.
- Click Apply.
- The nodes in the network should now be colored by type. Which is the most common types of edge? Least common?
To see details on specific edges, perform the following:
- In the Data Panel, click on the Edge Attribute Browser tab at the bottom of the window.
- In the Cytoscape Desktop window, under the Select menu, choose Mouse Drag Selects → Edges.
- Select edges in the network window by clicking the left mouse button in the network window, holding down the left mouse button (this should produce a rectangle), and dragging the far corner of the rectangle to intersect the selected edges.
- Observe how the list of edges changes in the Edge Attribute Browser as you select additional edges.
Now, we will step through the zooming commands, to get a closer look.
Zoom into the network using the Zoom In button:

- You can also zoom out using the Zoom Out button:zoomout.png
- Also, you can zoom to a selected region using the Zoom Selected Region button:zoomselected.png
Save current workspace as session file
Cytoscape can save all workspace states, including networks, attributes, visual styles, properties, and window sizes, into a session file. You can restore everything if you save your current workspace as session. To save as a session, click the Save icon on the toolbar.
Restore workspace from session file
To open the session file, click the Open Session File... icon on the toolbar. A warning pop-up window will be shown. Click Yes and select a session file. Then everything will be restored automatically from the file.
(Optional) Loading various kinds of networks from public databases
Cytoscape supports some standard formats for molecular interaction/pathway data exchange including BioPAX, SBML, and PSI-MI. You can find many data files in public databases. A comprehensive list of databases is available at Pathguide: the pathway resource list.
You can also load remote data file by copying and pasting the URL from a web browser. Here is an example:
Open the DNA Replication page in Reactome.
- On the bottom of this web page, there is a link named SBML. Right-click on the link and copy the link location (URL).
- Go back to the Cytoscape Desktop and select File → Import → Network (Multiple File Types)...
- Click the Remote radio button.
- Paste the URL in the text box.
- Click the Import button.
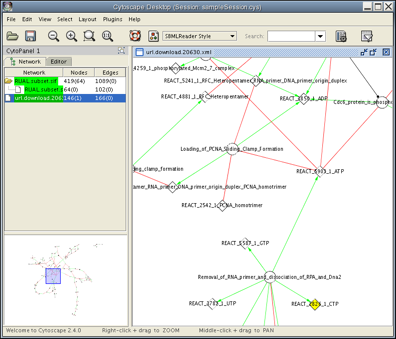
- After loading, you can apply any of the layout algorithms from Layout menu. Now the Cytoscape Desktop looks like the following:
Congratulations! You have bravely survived the least-exciting portion of Cytoscape instruction: learning to navigate the menu system. Go reward yourself with a cup of coffee!
For comments or suggestions, please post to the cytoscape-discuss mailing list.
Return to the Cytoscape introductory tutorials.
