|
← Revision 6 as of 2014-09-24 21:58:53
Size: 2329
Comment:
|
← Revision 7 as of 2014-09-24 22:29:57 →
Size: 3741
Comment:
|
| Deletions are marked like this. | Additions are marked like this. |
| Line 31: | Line 31: |
| Line 34: | Line 33: |
|
Our definition of interactive web visualization is a browser-based, complete web application to visualize your data just like desktop version of Cytoscape. To accomplish this goal, we used Cytoscape.js and other web based technologies to visualize as much information as possible from the original Cytoscape network visualizations. This function simply compresses everything, including your network/table JSON files, visual styles, and template HTML/JavaScript/CSS files, into a zipped archive. Once you upload unzipped folder to your web server, you can publish your result as a web application. There are two options in this feature: |
|
| Line 36: | Line 38: |
|
{{attachment:web_export_simple.png}} |
|
| Line 38: | Line 43: |
| {{attachment:web_export_full.png}} | |
| Line 39: | Line 45: |
|
=== Customize Export Template (For Advanced Users) === HTML5 template code is stored in **~/CytoscapeConfiguration/web** directory and it is user customizable. |
=== Compatibility === Because we use latest HTML5 based web technologies, we cannot support old web browsers such as IE. We strongly recommend to use latest version of modern web browsers such as Google Chrome, Mozilla Firefox, or Apple Safari. === Customize Export Template (For Advanced Users Only) === This feature creates minimalistic web application to visualize your network, but you may want to use your own design or add new features to the application. It is possible by editing template code in your configuration directory. The HTML5 template code is stored in '''''~/CytoscapeConfiguration/web''''' directory. In the ''web'' folder, you can find '''''simple''''' and '''''full''''' sub directories. These are the template code for each export option. ==== Source Code ==== * Simple export template * Full export template |
When you finish your data analysis and its visualization, you need to publish your data to share the results. Cytoscape has several options to do it.
As Session File
The easiest way to share your results with others is simply send the session file. You can save everything in one zipped archive file by clicking Save Session icon.
As Images
Cytoscape can generate publication-quality images from the network views. By selecting File → Export → Network View as Graphics... you can export the current network view into the following files:
- JPG
- PNG
- PS (Post Script)
- SVG
We recommend to to use PDF for publications because it is the standard vector graphics format and is easy to edit in other applications such as Adobe Illustrator.
Known Issues
For PDF export, there is an option to Export Texts as Fonts. This option does not work for two-byte characters such as Chinese or Japanese letters. To avoid corrupted texts in your publication, please uncheck this option when you publish networks including those non-English characters.
As Interactive Web Applications (New in 3.2.0)

These days, web is the platform data sharing and collaboration. Since version 3.1.0, Cytoscape has Export as Cytoscape.js JSON feature for publishing your data as browser-based visualization. However, the main target of the feature was developers because users have to write some code to set up their web pages to visualize the JSON files with Cytoscape.js. It provides maximum flexibility to people who has JavaScript programming experience, but it was not for end-users. To deliver the versatility of web based visualizations, we have developed a new feature, Export as Interactive Web Visualization, which is a one-click option to create your own web based visualization from your Cytoscape session.
What is Interactive Web Visualization?


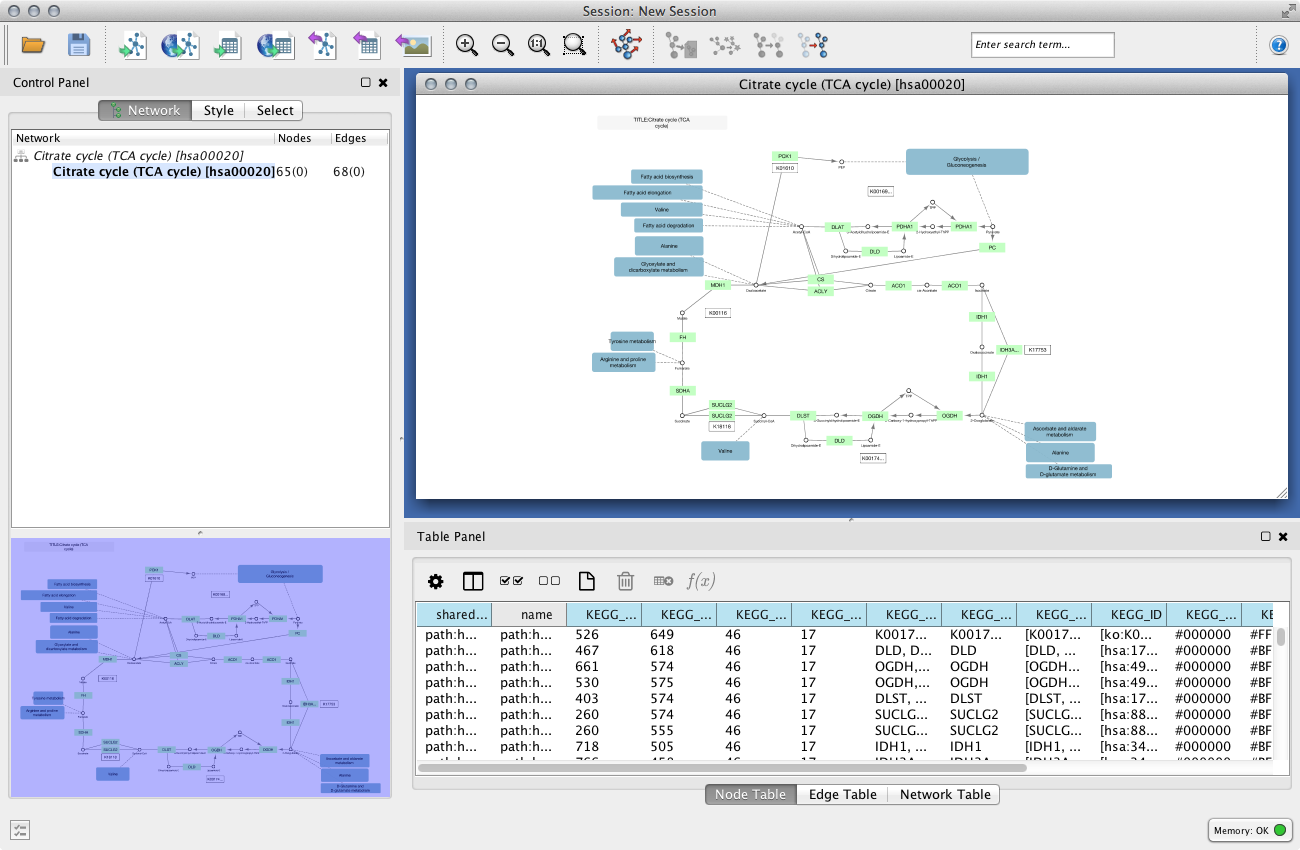
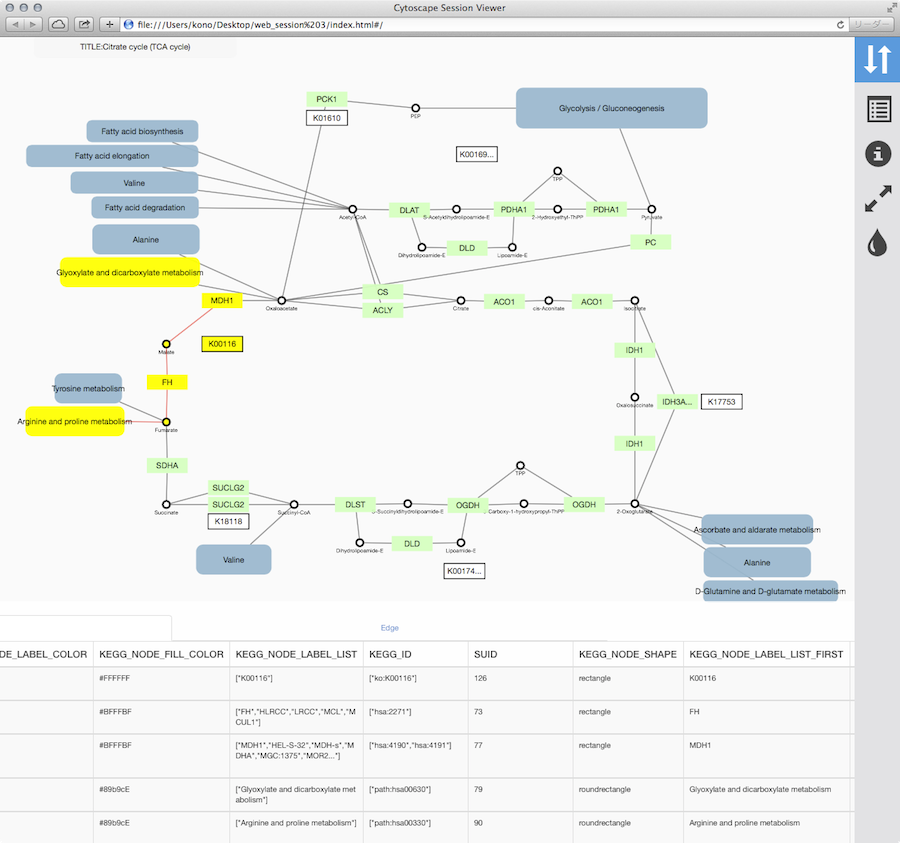
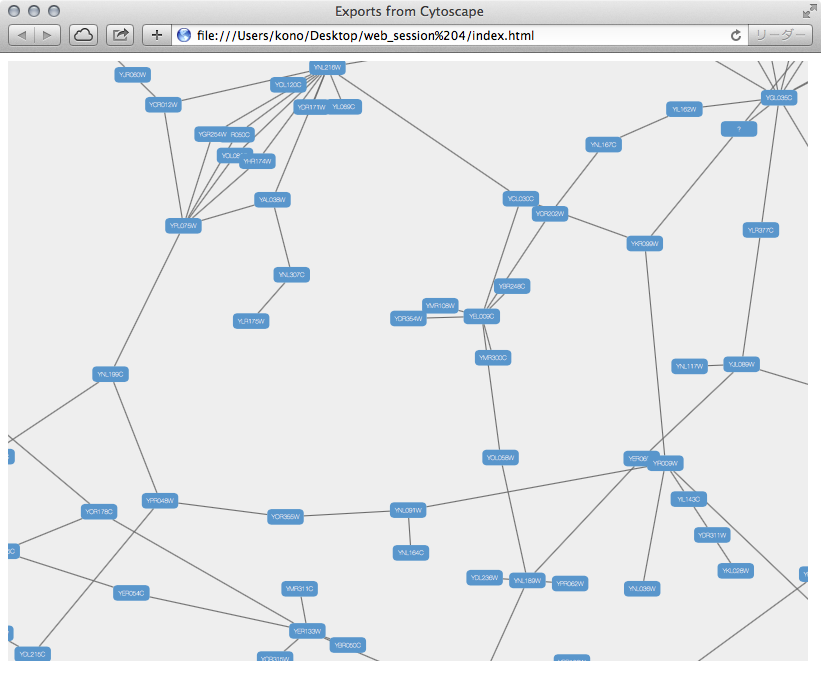
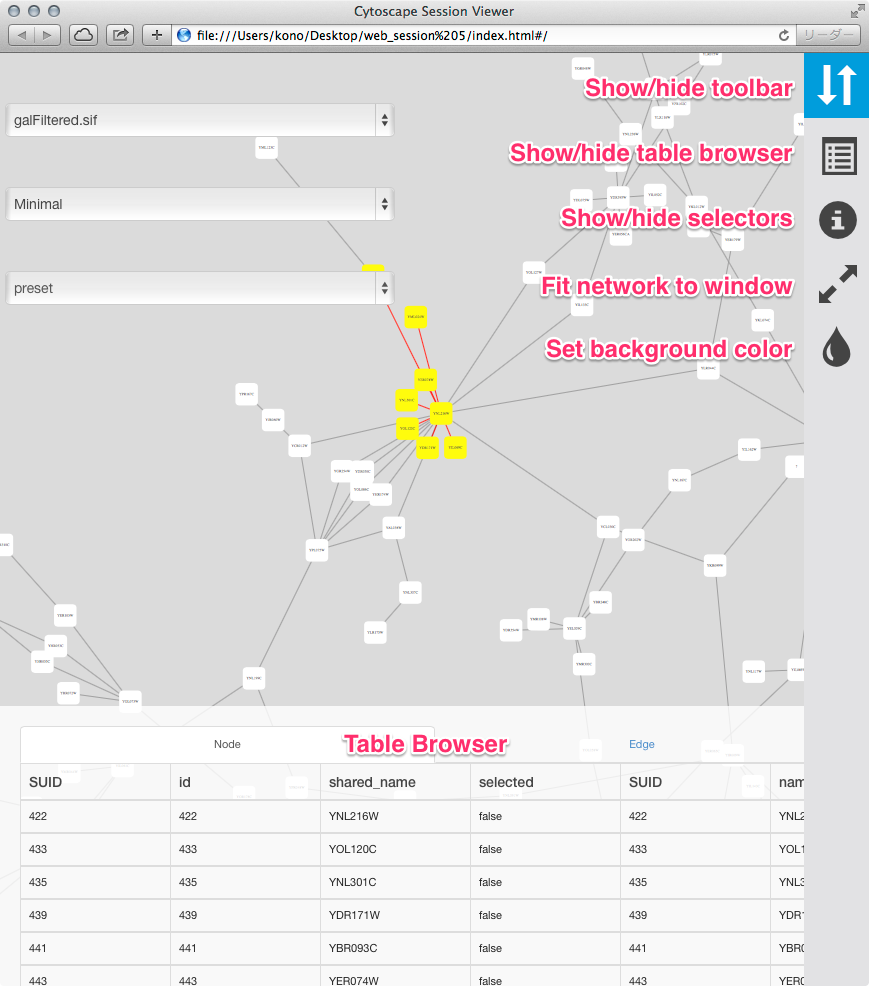
Our definition of interactive web visualization is a browser-based, complete web application to visualize your data just like desktop version of Cytoscape. To accomplish this goal, we used Cytoscape.js and other web based technologies to visualize as much information as possible from the original Cytoscape network visualizations. This function simply compresses everything, including your network/table JSON files, visual styles, and template HTML/JavaScript/CSS files, into a zipped archive. Once you upload unzipped folder to your web server, you can publish your result as a web application.
There are two options in this feature:
Simple Network View

Full Web Application

Compatibility
Because we use latest HTML5 based web technologies, we cannot support old web browsers such as IE. We strongly recommend to use latest version of modern web browsers such as Google Chrome, Mozilla Firefox, or Apple Safari.
Customize Export Template (For Advanced Users Only)
This feature creates minimalistic web application to visualize your network, but you may want to use your own design or add new features to the application. It is possible by editing template code in your configuration directory. The HTML5 template code is stored in ~/CytoscapeConfiguration/web directory. In the web folder, you can find simple and full sub directories. These are the template code for each export option.
Source Code
- Simple export template
- Full export template