|
← Revision 1 as of 2013-12-16 23:01:02 →
Size: 1176
Comment:
|
Size: 2124
Comment:
|
| Deletions are marked like this. | Additions are marked like this. |
| Line 10: | Line 10: |
| === Analyze Network === |
=== Network Analysis === ==== Analyze Network ==== |
| Line 12: | Line 13: |
| To run !NetworkAnalyzer, select '''Tools → NetworkAnalyzer → Network Analysis → Analyze Network'''. | To run !NetworkAnalyzer, select '''Tools → !NetworkAnalyzer → Network Analysis → Analyze Network'''. |
| Line 18: | Line 19: |
|
When results are calculated, they will appear in the '''Results Panel'''. {{attachment:NetworkAnalyzerResults.png}} The statistics has multiple tabs: * '''Simple Parameters''': * '''Node Degree Distribution''': The node degree distribution is shown in a log-log plot. The x axis enumerates the degrees of nodes in the network, and the y axis shows the frequency of nodes with a given degree. * '''Topological Coefficients''': * '''Shortest Path Distribution''': * '''Shared Neighbors Distribution''': * '''Neighborhood Connectivity Distribution''': * '''Betweenness Centrality''': * '''Closeness Centrality''': * '''Stress Centrality Distribution''': |
|
| Line 20: | Line 35: |
| ==== Analyze Subset of Nodes ==== | |
| Line 21: | Line 37: |
|
==== Batch Analysis ==== ==== Generate Style from Statistics ==== ==== Load Network Statistics ==== ==== !NetworkAnalyzer Settings ==== ==== Plot Parameters ==== === Subnetwork Creation === |
NetworkAnlayzer computes a comprehensive set of topological parameters for undirected and directed networks, including:
- Number of nodes, edges and connected components.
- Network diameter, radius and clustering coefficient, as well as the characteristic path length.
- Charts for topological coefficients, betweenness, and closeness.
- Distributions of degrees, neighborhood connectiveness, average clustering coefficients, shortest path lengths, number of shared neighbors and stress centrality.
NetworkAnalyzer also constructs the intersection, union and difference of two networks. It supports the extraction of connected components as separate networks and the removal of self-loops.
Network Analysis
Analyze Network
To run NetworkAnalyzer, select Tools → NetworkAnalyzer → Network Analysis → Analyze Network.

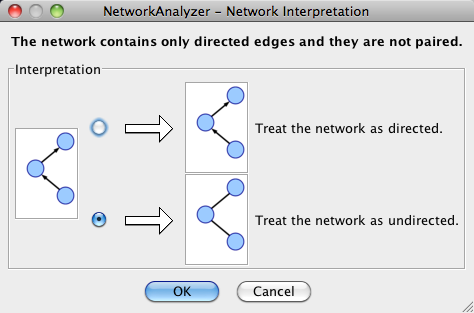
The NetworkAnalyzer will determine whether your network contains directed or undirected edges. At this point, you can choose to ignore edge direction information.
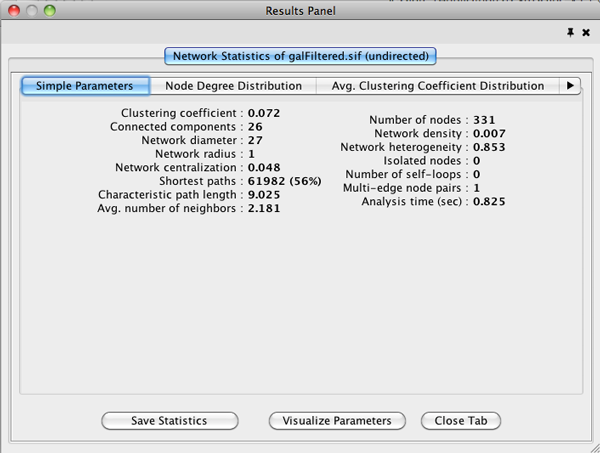
When results are calculated, they will appear in the Results Panel.

The statistics has multiple tabs:
Simple Parameters:
Node Degree Distribution: The node degree distribution is shown in a log-log plot. The x axis enumerates the degrees of nodes in the network, and the y axis shows the frequency of nodes with a given degree.
Topological Coefficients:
Shortest Path Distribution:
Shared Neighbors Distribution:
Neighborhood Connectivity Distribution:
Betweenness Centrality:
Closeness Centrality:
Stress Centrality Distribution:
Analyze Subset of Nodes
Batch Analysis
Generate Style from Statistics
Load Network Statistics
!NetworkAnalyzer Settings
Plot Parameters
Subnetwork Creation
Explanation of analysis parameters: http://med.bioinf.mpi-inf.mpg.de/netanalyzer/help/2.7/index.html#simple